Product
January 12, 2024
Revenue was rising, but profitability wasn’t. A cost-to-serve analysis revealed a $12 loss per order and showed how seemingly healthy growth could scale into roughly $300,000 in annual losses.
Revenue was rising. Orders were increasing. New customers were coming in. On the surface, the business appeared to be having a strong quarter. But when the team examined margin and cost-to-serve—not just topline growth—they uncovered a loss of $12 per order. Left unchecked, the current trajectory could have produced roughly $300,000 in annual losses.
A growing company entered Q1 with strong headline numbers.
Revenue was up 18 percent. Order volume was increasing. New customers were coming in. By the usual measures, the quarter looked healthy, and the sales team had every reason to feel encouraged.
But strong topline growth was only part of the story.
Once the team looked beyond revenue alone, they found that the economics underneath that growth were moving in the wrong direction. The business was processing more orders and serving more customers, but margin was not improving with it.
That shift in perspective changed the conversation. What looked like momentum at first glance turned out to be a case where growth was increasing activity without improving profitability.
Revenue is one of the most visible business metrics, but it does not show what it costs to create and fulfill that revenue.
Two customers may generate the same sales value while producing completely different margins.
One may purchase at full price, choose standard shipping, require minimal service, and rarely return an item.
Another may receive a large discount, place operationally complex orders, require expedited shipping, and create frequent returns.
A revenue dashboard may treat those customers as equally valuable.
A cost-to-serve analysis will not.
To understand why growth was not improving margin, the company needed to move beyond total revenue and ask a more useful question:
What does each order contribute after the real cost of serving it?
To understand what was happening, the team looked more closely at the operational and commercial costs tied to each order.
The issue was not one isolated expense. It was a combination of factors that, on their own, might have seemed manageable, but together changed the economics of growth. Some orders required more handling, coordination, and manual effort than expected. Return volume was also reducing the value of completed sales while adding shipping, inspection, restocking, and customer-service costs. On top of that, faster shipping options were improving the customer experience while increasing cost per order, and some discounted pricing tiers were leaving too little contribution margin once fulfillment and variable costs were included.
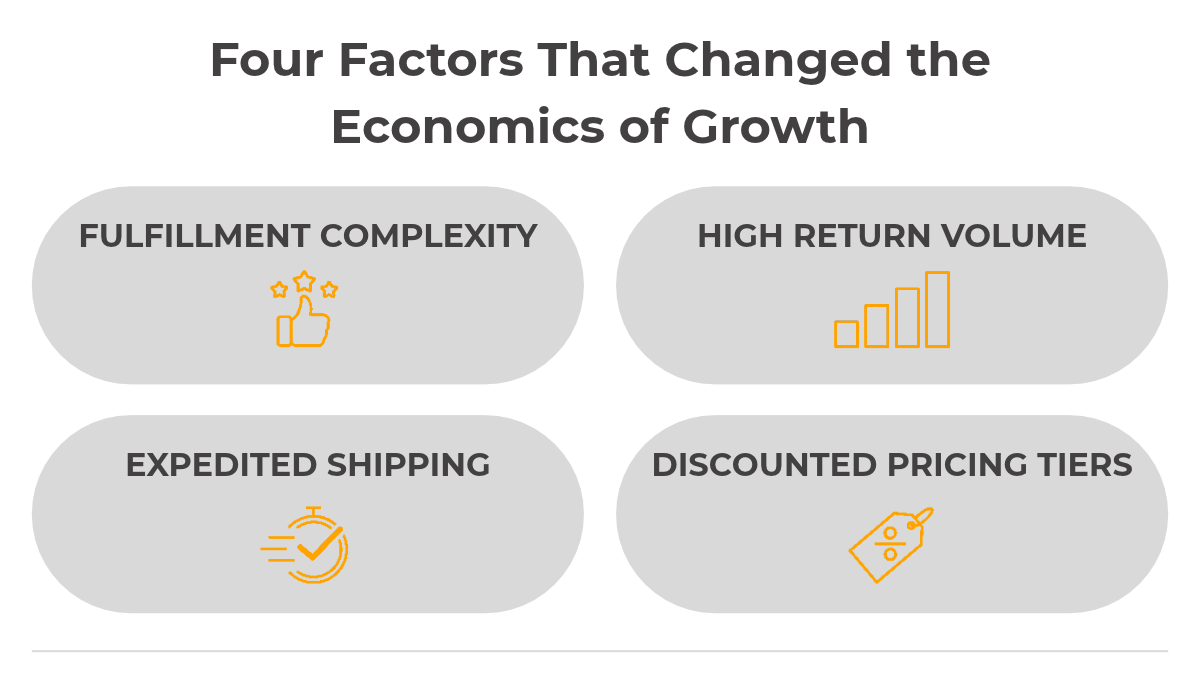
Taken together, these pressures explained why revenue growth was not translating into healthier margins.
Once those costs were viewed together, the team could calculate the contribution of each order more completely.
Revenue per order looked positive on the surface. But after variable costs, fulfillment costs, and discounts were accounted for, the result was approximately negative $12 per order.
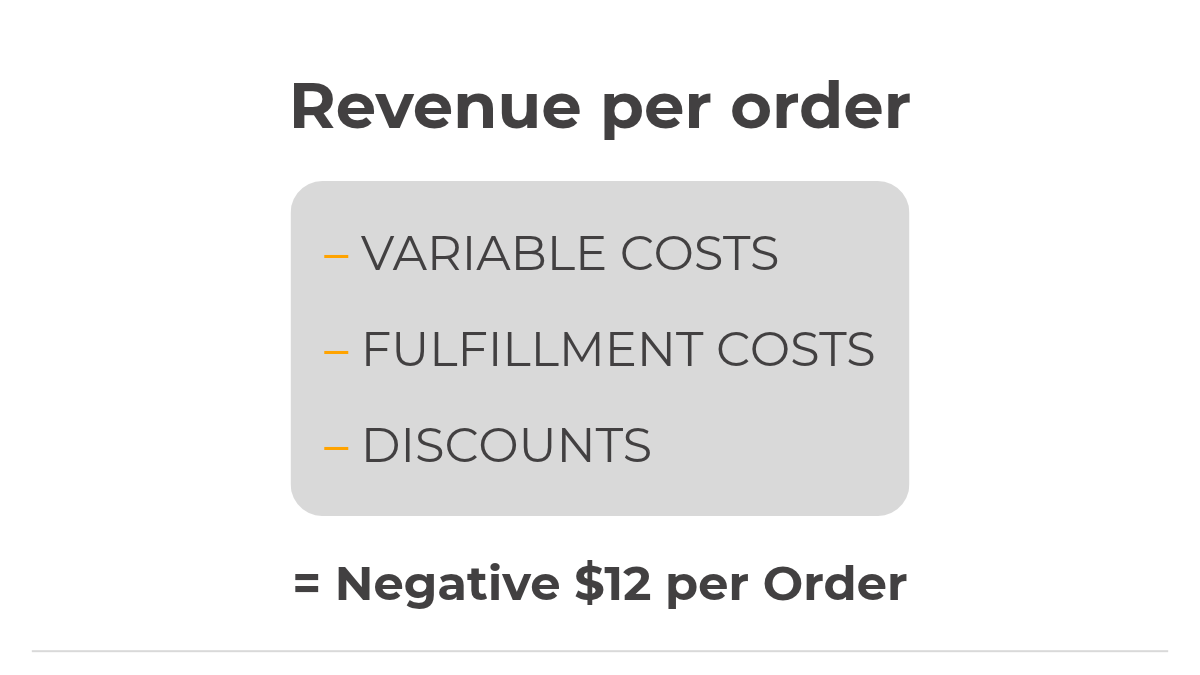
That number changed the interpretation of the quarter. The company was not simply growing with temporarily compressed margins. It was adding volume to an operating pattern that was losing money with each incremental order.
A $12 loss on a single order may not sound urgent at first. But at growing order volumes, unit economics compound quickly.
When the team projected the pattern across a full year, the impact approached $300,000 in annual losses. That meant the real risk was not that growth would slow down. It was that the company would continue growing under a model that was quietly scaling loss instead of value.
What made the insight so important was not just the number itself. It was the contrast between appearance and reality. From the outside, the quarter looked strong. Underneath, the business needed intervention before that growth became far more expensive to sustain.
Once the problem was clear, the next step was to respond in ways that would improve the economics of each order.
The company adjusted pricing, restructured shipping thresholds, and paused a low-margin segment that was contributing volume without enough value. These were practical operational changes, but they were only possible because the analysis made the problem specific.
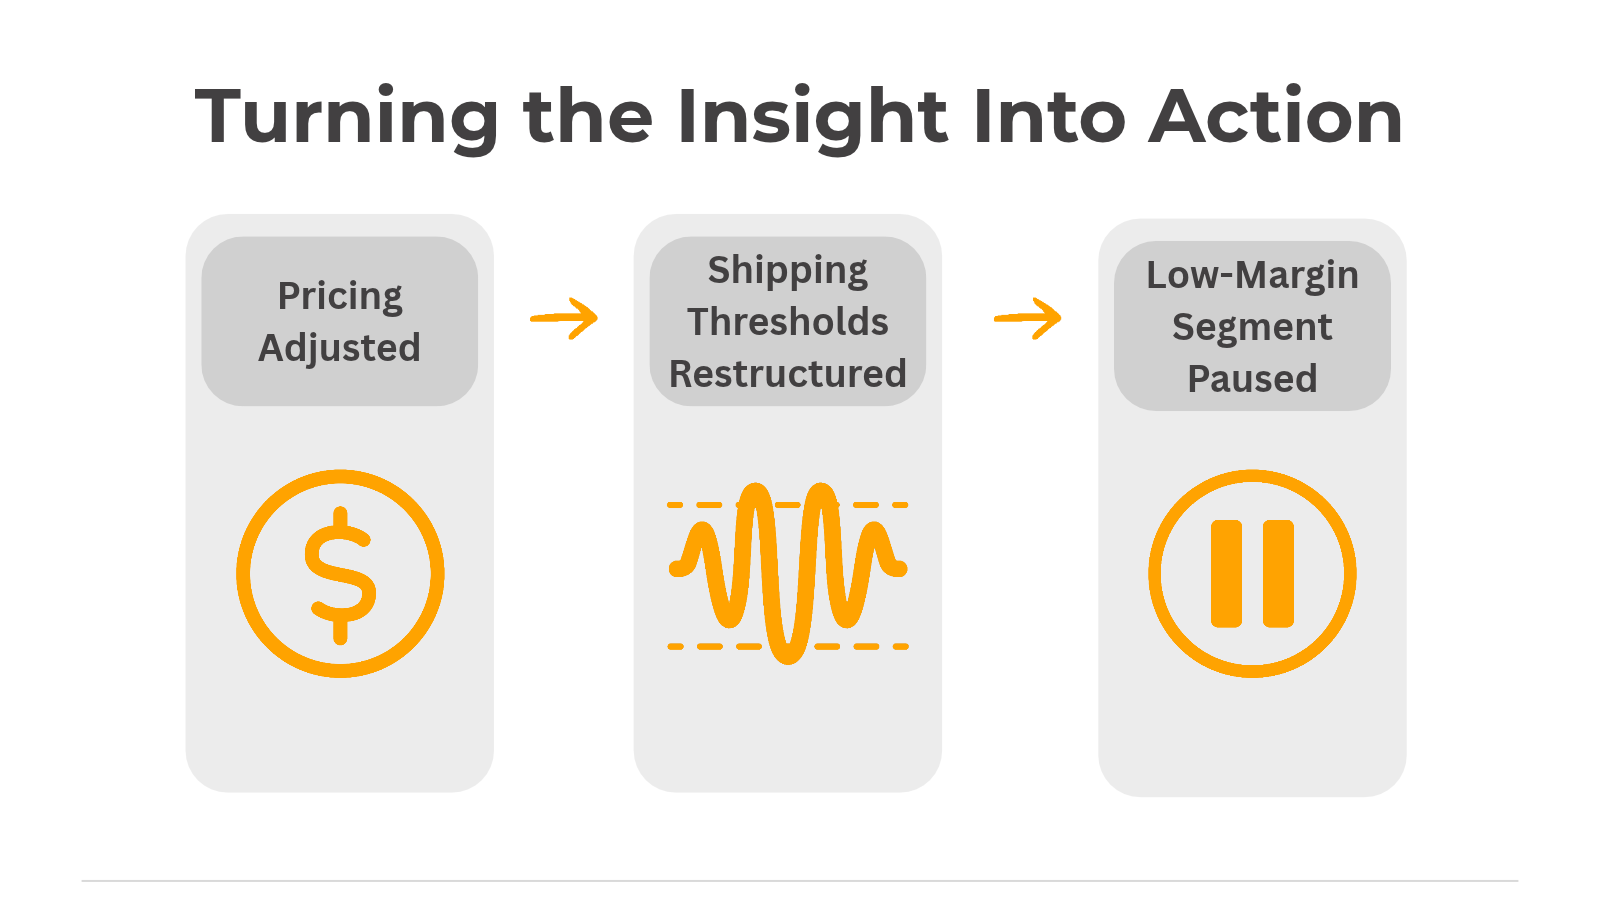
Instead of reacting broadly to revenue trends, the business could make targeted changes tied to the actual drivers of margin.
The analysis did more than reveal an unfavorable metric.
It changed a decision while the cost of correction was still manageable.
Without the cost-to-serve view, the company might have responded to its strong revenue results by investing further in acquisition, fulfillment capacity, and sales expansion.
That would have accelerated the very pattern creating the loss.
Instead, the company could protect margin before increasing scale.
Better data changed the timing and direction of the decision.
Revenue still matters, but it should be evaluated alongside the economics required to produce it.
Looking at topline performance alone can hide the cost patterns that determine whether growth is creating value. Depending on the business, that broader view may include contribution margin per order, fulfillment cost, shipping cost by customer or segment, return-related cost, discount rate, customer-service effort, product profitability, and margin after variable operating costs.
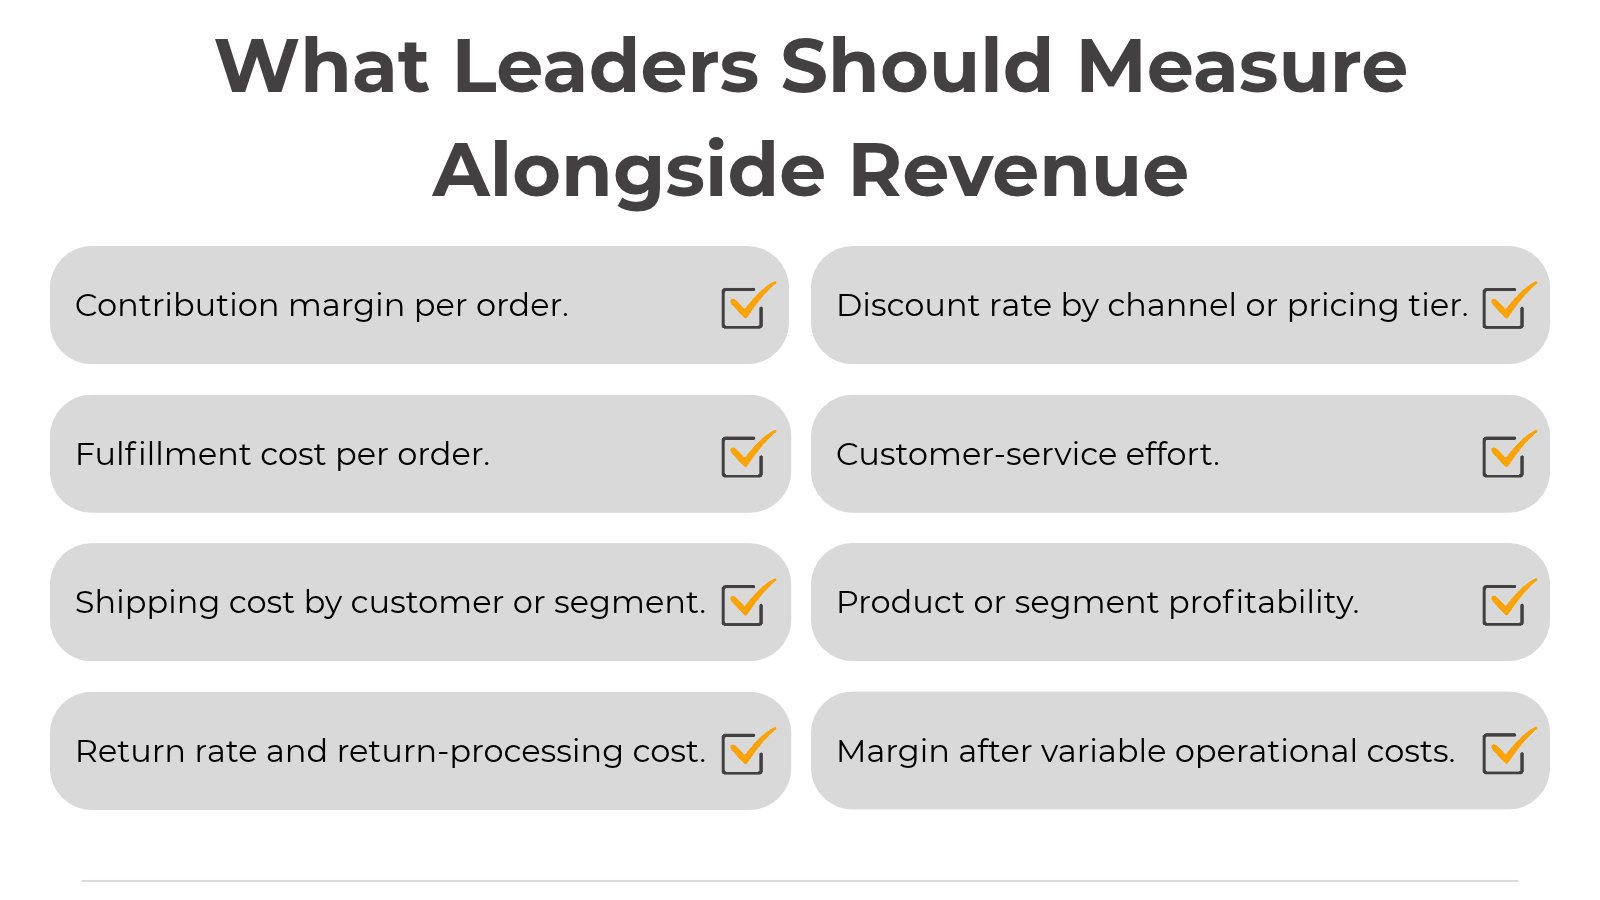
Measures like these help leaders distinguish between growth that creates value and growth that only increases activity.
What made the analysis effective was not complexity. It was focus.
The team treated revenue growth as a signal to investigate, not proof that performance was improving. Costs were connected back to individual orders, which made the issue measurable and actionable. Most importantly, the analysis produced a number the business could respond to.
That is often what strong analytics does best. It turns broad performance trends into decisions leaders can act on with confidence.
Growth is only healthy when the economics improve with it.
Revenue can rise while profitability declines.
Customer acquisition can accelerate while the cost of serving those customers creates losses.
A strong quarter can conceal a weak operating model.
That is why leaders should reconcile revenue with cost-to-serve early—before volume turns a small unit-level problem into a six-figure mistake.
The earlier the margin is understood, the cheaper the lesson.
Interested in understanding which customers, products, or orders are actually driving profitable growth?
👉 Contact NexusLeap to learn how our team connects revenue, operational costs, and customer behavior to reveal the real economics behind business performance.

At NexusLeap, we’re united by a singular mission: equip our clients with decision-making analytical tools.


Facilitates seamless business operations.
Copyright © 2024 by NexusLeap, LLC.