
Product
January 12, 2024
Dashboards should do more than report performance. The best ones help leaders understand what changed, why it matters, who owns the response, and what action to take next.
Most dashboards are built to answer a simple question: what happened?
That is useful, but it is not enough.
A dashboard can be polished, accurate, interactive, and full of important metrics while still leaving leaders unsure what to do next. The numbers may be visible, but the decision remains unclear.
Is performance actually good or bad? Are we meaningfully off plan? Is the gap temporary or getting worse? Who needs to respond? What can the business change while there is still time to affect the outcome?
If the dashboard cannot help answer those questions, it may be reporting performance, but it is not yet supporting decisions.
The strongest dashboards are not designed around what data is available. They are designed around the decisions a business needs to make.
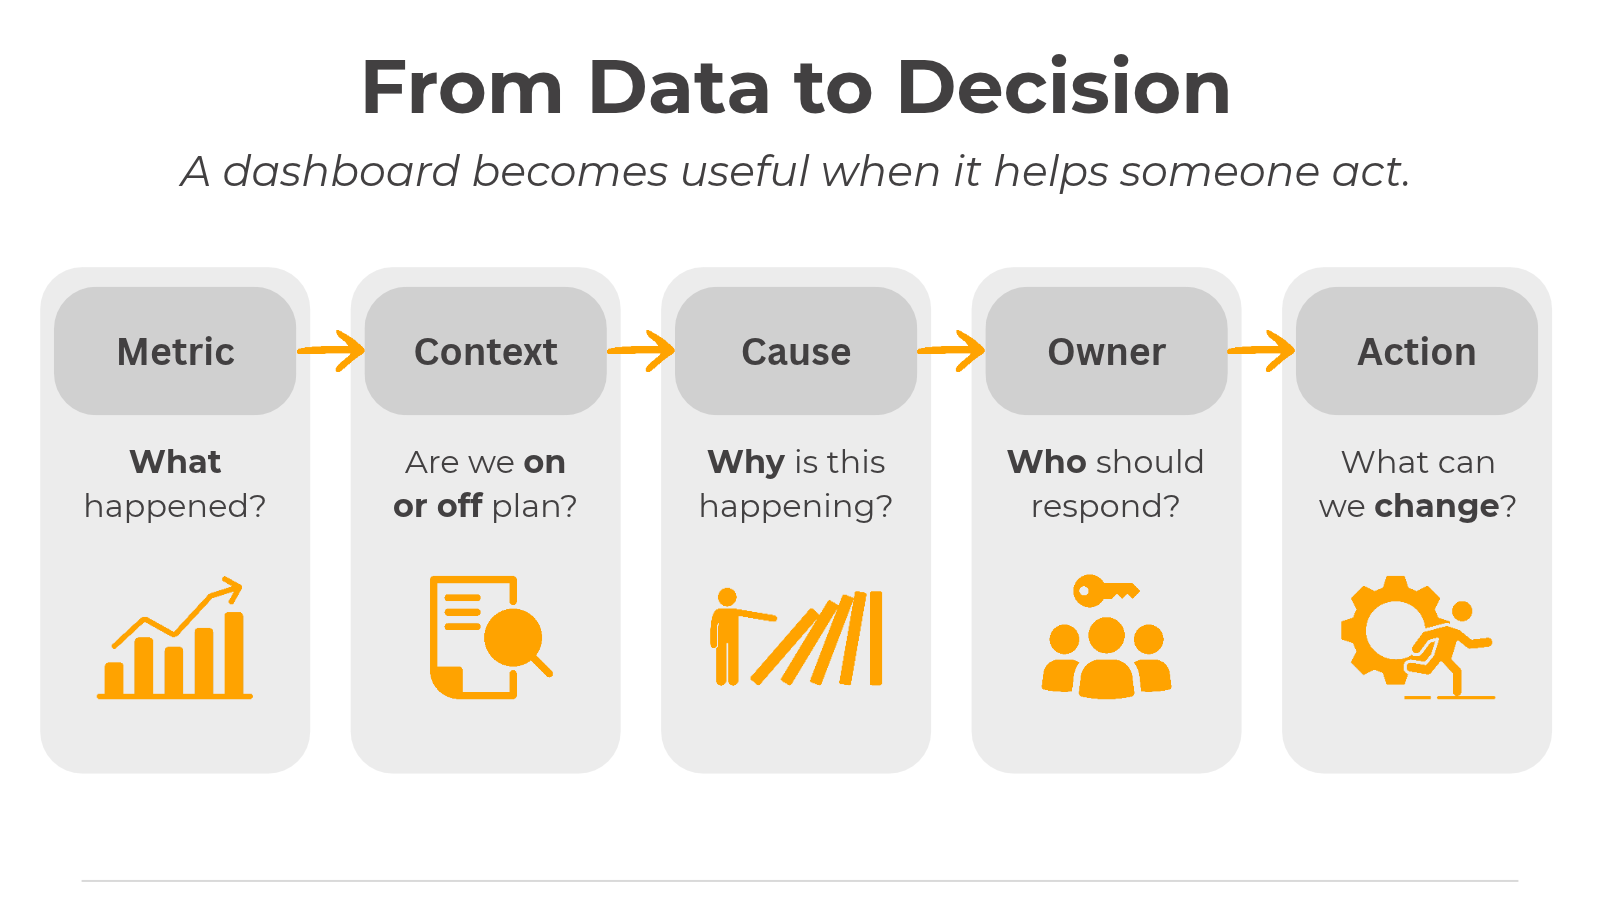
Dashboard projects often begin with a familiar exercise: identify the KPIs, collect the available data, and decide how to display it.
That approach can produce a useful reporting tool. It can also produce a beautifully organized collection of metrics that everyone watches and nobody acts on.
A better starting point is the decision itself.
What should someone be able to decide after looking at this dashboard? Who makes that decision? What change in performance should cause them to respond? What action becomes possible when the number moves?
Those questions change the way the dashboard is built.
A sales dashboard, for example, might exist to help leaders decide whether to adjust pricing, redirect marketing investment, change territory coverage, or intervene in a slowing pipeline.
An operations dashboard might inform staffing, capacity, scheduling, sourcing, or process changes.
A finance dashboard might help leadership decide when to revise a forecast, control spending, or shift resources.
The metrics matter because of the decisions they support, not simply because the organization can measure them.
If no decision changes, the dashboard has not finished its job.
Even a trusted metric can be hard to act on without context.
Revenue of $2.1 million may sound positive until the plan was $2.4 million.
An 8% increase in customer acquisition may look encouraging until the business expected 15%.
Operating costs of $750,000 tell a very different story if the budget was $680,000.
This is why decision-ready dashboards should make the gap between actual performance and expected performance obvious.
The important question is rarely just, “What is the number?”
It is, “How does the number compare with where we expected to be?”
Actuals versus plan, meaningful variance, direction of movement, and relevant prior-period context give leaders something they can interpret. They turn a metric into a signal.
Decisions happen in those gaps.
A leader is far more likely to act on “Revenue is 12% below plan” than on “Revenue is $2.1 million.”
Showing that performance is off plan is only the beginning.
The next question is why.
If revenue is below expectations, the dashboard should help narrow attention toward the factors most responsible. Perhaps conversion is down. Maybe retention weakened, the sales cycle slowed, pricing changed, or product availability became a constraint.
The same principle applies operationally. A missed target may trace back to staffing, capacity, supplier performance, cycle time, or rework.
The goal is not to surround the headline metric with every related number the organization can find.
More data does not automatically create more clarity.
A useful dashboard helps leaders move from the outcome to the few drivers most likely to explain it. That is what turns “we are off plan” into a conversation about what the business can actually do.
Historical reporting tells leaders where the business has been.
Decision support also needs to help them understand where it is heading.
That becomes especially important early in a planning period. A variance in the first few weeks or months can be meaningful, or it can simply reflect timing and a small sample size.
The dashboard should help leaders distinguish between the two.
If the current run rate continues, where are we likely to land? Is the variance narrowing or growing? How much time remains to intervene? Does the current pattern suggest a structural issue, or is the signal still too early to treat as one?
This does not require pretending the future can be predicted perfectly.
The purpose is directional awareness.
Leaders rarely need a flawless forecast before taking action. They need enough credible information to understand whether continuing on the current path is acceptable.
None of this works if the meeting immediately turns into an argument about whether the numbers are right.
A dashboard can have excellent design and still fail as a decision tool if Finance, Operations, Sales, and leadership are working from different definitions or unreconciled data.
Before a metric becomes a basis for action, people need to understand where it comes from, when it was refreshed, whether teams share the same definition, and whether any known limitations affect interpretation.
Those limitations should be visible.
If the current month is still preliminary, say so. If returns are reflected after a delay, make that clear. If one region is temporarily excluded because of a source-system change, label it.
Transparency creates confidence. Ambiguity stalls decisions.
Trust, however, is only one side of the equation.
Someone also needs to own the response.
When performance materially deviates, who is expected to investigate? Who has the authority to act? Who coordinates the teams involved?
Giving everyone access to a dashboard does not create accountability. In fact, when everyone is responsible for “watching” a number, it is surprisingly easy for nobody to own what happens next.
A decision-ready dashboard connects information to a person who can do something with it.
The final question is the most practical one:
If this number changes, what can we actually adjust?
Depending on the business, the answer might be pricing, marketing spend, sales coverage, staffing, capacity, inventory, vendor allocation, retention efforts, or the product experience itself.
Those are the levers that make a KPI actionable.
A metric can be interesting without belonging on an executive dashboard. If a number moves but nobody owns it and the organization has no plausible response, its value may be informational rather than operational.
That distinction matters.
Metrics without decisions become decoration.
Metrics without owners become observations.
Metrics without levers become vanity metrics.
The best dashboards connect all three.
Before adding another KPI, ask five questions:
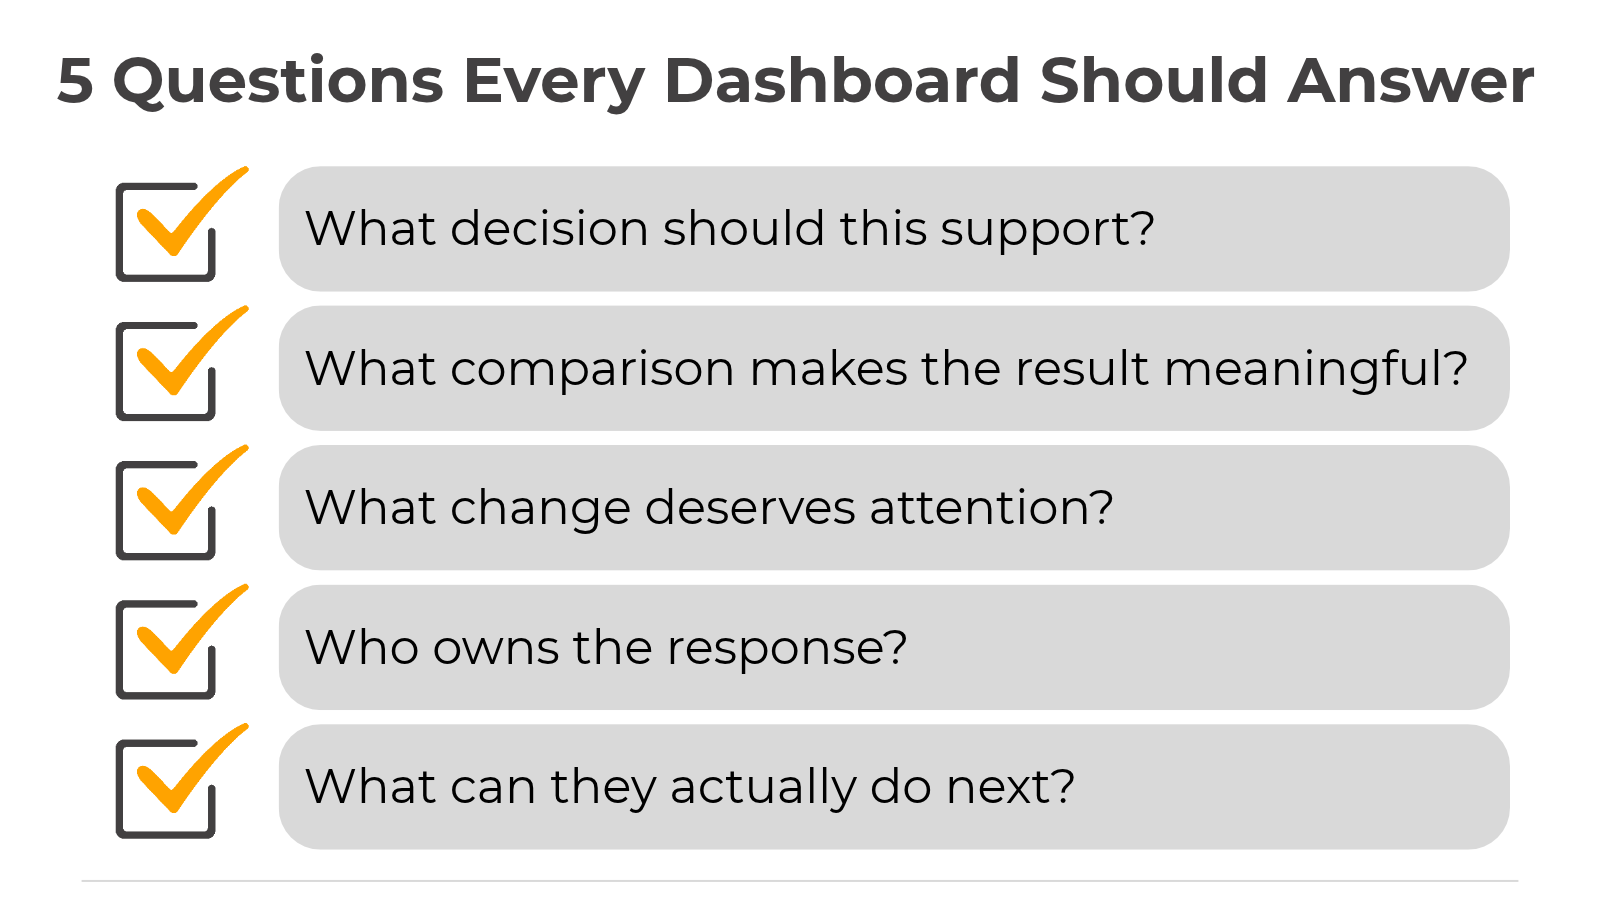
If those answers are clear, the dashboard has a reason to exist.
If they are not, another chart probably will not solve the problem.
A dashboard should do more than make performance visible.
It should tell leaders whether the organization is on plan, make important deviations easy to see, help explain what is driving them, and give an accountable owner enough context to decide what should change.
That requires trusted numbers, shared definitions, meaningful comparisons, clear ownership, and practical business levers.
The visual design still matters. Good design helps people understand the information faster.
But aesthetics are not the outcome.
The outcome is a better decision.
Because if the dashboard refreshes and everyone sees the new numbers, but nobody behaves differently, the dashboard has not completed its job.
Interested in building dashboards that turn trusted data into measurable action?
NexusLeap helps organizations align definitions, reconcile critical metrics, clarify ownership, and design analytics products around the decisions that drive business performance.

At NexusLeap, we’re united by a singular mission: equip our clients with decision-making analytical tools.


Facilitates seamless business operations.
Copyright © 2024 by NexusLeap, LLC.