Product
January 12, 2024
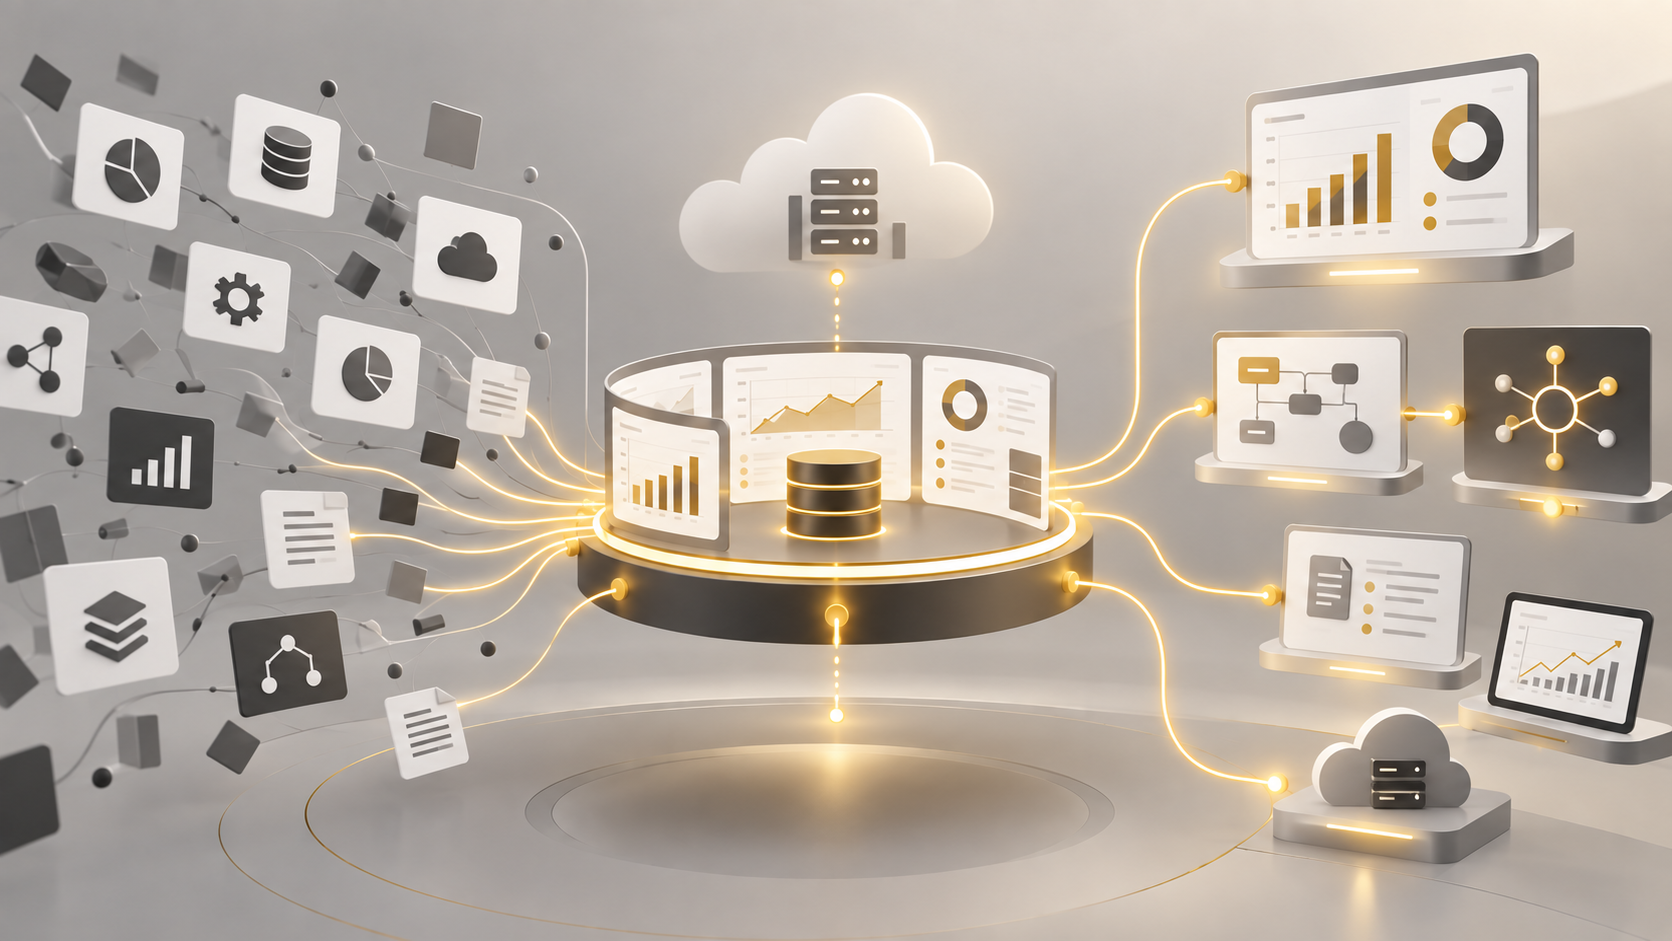
NexusLeap transformed a scattered analytics environment into a connected, full-stack analytics hub—bringing data, dashboards, documentation, admin controls, and LLM-powered assistance into one shared ecosystem built for faster, more intuitive analytics.
Discover how NexusLeap helped transform a scattered analytics environment into a connected, full-stack analytics hub. By combining AWS infrastructure, a custom web app, clean data models, dashboards, documentation, admin controls, and LLM-powered assistance, the team created a simpler way for users to access data, understand insights, and work from one shared ecosystem.
Analytics should help teams move faster, not send them on a scavenger hunt.
But when data, dashboards, documentation, and admin workflows live across too many separate tools, even simple questions can become difficult to answer. New team members have to learn where everything lives. Analysts have to jump between systems. Business users may not know which dashboard or dataset to trust.
That was the challenge this project set out to solve.
NexusLeap helped transform a fragmented analytics environment into a connected full-stack analytics hub: one place for data ingestion, querying, analytics, dashboards, documentation, and administrative control.
The goal was not just to build another dashboard. It was to create a seamless data experience.
There was no single place for data analytics.
Data was separated across tools. Dashboards were not shared in a consistent way. Quick answers were hard to find. Complex decisions stalled because “truth” lived in too many places.
For users, that meant extra friction. Finding the right data could require checking multiple systems, asking the right person, or manually piecing together context from disconnected sources.
For teams, that meant slower onboarding, more duplicated effort, and less confidence in the analytics workflow.
In short: the organization needed a connected hub that made analytics easier to find, use, and trust.
The goal was to build an all-in-one web app that could bring the analytics experience together.
The platform needed to support:
Instead of forcing users to move across separate tools to answer one question, the solution would give researchers, analysts, and business users a more unified ecosystem.
One connected place. Cleaner workflows. Faster answers.
NexusLeap designed a full-stack analytics platform with AWS infrastructure as the foundation and a custom web app as the user-facing experience.
The platform brought together the technical layers needed to support a modern analytics workflow:
Each tool played a role, from automation to visualization. Together, they helped turn a scattered analytics toolkit into a more connected, usable platform.
A major part of the solution was reducing fragmentation.
In many analytics environments, the data may live in one place, dashboards in another, documentation somewhere else, and admin workflows in yet another system. That separation creates technical and operational friction.
The custom analytics hub was designed to bring those pieces closer together.
Users could access dashboards, documentation, and data workflows through a single connected experience. Administrators could manage access and controls more clearly. Analysts could work from cleaner data models and a more reliable foundation.
That connected experience helped reduce technical gatekeeping. Instead of relying on tribal knowledge or manual handoffs, more users could find what they needed and understand how to use it.
The platform was built around a simple idea: when data lives together, teams work smarter.
Clean data models helped create a more dependable analytical foundation. Shared dashboards made insights easier to access. Documentation gave users more context. Access controls helped ensure the right people could use the right information.
The addition of LLM-powered assistance also pointed toward a more intuitive analytics experience: one where users can get help understanding, navigating, or exploring information without needing to know every technical detail behind the system.
The result was not just a better backend. It was a better user experience around the data.
The transformation gave researchers and analysts one connected ecosystem for analytics work.
Instead of scattered tools and disconnected sources of truth, the new platform created a more organized way to work with data.
Key outcomes included:
✅ A custom full-stack analytics hub
✅ Cleaner data models to support trusted reporting
✅ Shared dashboards in a more unified experience
✅ Documentation connected to the analytics workflow
✅ Admin controls for better platform management
✅ LLM-powered assistance to support easier data exploration
✅ A simpler, scalable setup more users could navigate
Now, answers could live closer to one place.
This project worked because the solution focused on both the technical foundation and the user experience.
AWS infrastructure provided the scalable base. Streamlit and Superset supported interactive applications and dashboards. GitHub Actions helped support automation. Clean data models gave the platform trusted analytical structure.
But the real value came from connecting those pieces into one experience.
A strong analytics platform is not only about where the data is stored. It is also about how people find it, understand it, trust it, and use it to make decisions.
When data lives together, teams work smarter.
A connected analytics hub can reduce friction, improve trust, and make insights easier to access across the organization. Instead of chasing information across multiple tools, teams can work from a shared ecosystem built for speed, clarity, and usability.
The best analytics platforms do more than centralize data.
They connect the full experience around it.
Interested in building a connected analytics experience for your team?
👉 Contact us to learn how NexusLeap builds full-stack analytics platforms that bring data, dashboards, documentation, and decision-making into one scalable hub.

At NexusLeap, we’re united by a singular mission: equip our clients with decision-making analytical tools.


Facilitates seamless business operations.
Copyright © 2024 by NexusLeap, LLC.